

On my metrics server, I'm using what's called the TIG stack, which is Telegraf, Influxdb, Grafana.
Telegraf is a collector. It is installed on the local and remote machines. It is highly configurable and supports collecting data locally, like system data, and it is also able to collect remote data using SNMP, if I have the correct MIB files to monitor remote machines.
Influxdb is a time series database. It's able to collect data in real time and store it on the server. In my server, Telegraf is configured to send metrics to this Influxdb database. Telegraf send this data via HTTP. It also supports other protocols, such as UDP, which my Proxmox server uses.
Grafana is the open source analytics & monitoring solution that works with what's called datasources. A datasource is where Grafana will find the data it needs to display metrics. In my case, the datasource is my Influxdb database, because that's where every metric is stored thanks to Telegraf. I can create a lot of dashboards with useful info in Grafana.
I've made dashboards for every server I own, my pfSense firewalls and my Synology NAS. My Linux servers and firewalls use Telegraf to send metrics to Influxdb, and my NAS gets metrics fetched directly by the Grafana server because Synology doesn't provide a Telegraf package, but they do provide MIB files.
My pfSense dashboard gives me information about the system, disks, interfaces, and throughput. I mainly use it to check the network metrics, so I can see the usages of my network interfaces in real time.
The metrics that show CPU usage, load average, and disk usage also help me see if there is a problem before it becomes critical, even if these things are already monitored by my Centreon server.
I also monitor pfblocker-ng on my pfSense, so I can see how many domains are blocked, what are these domains, and from which IP the request comes from.


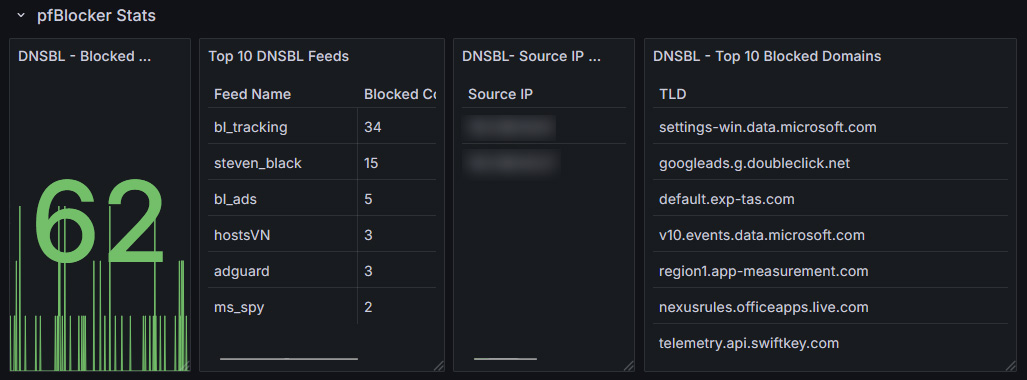
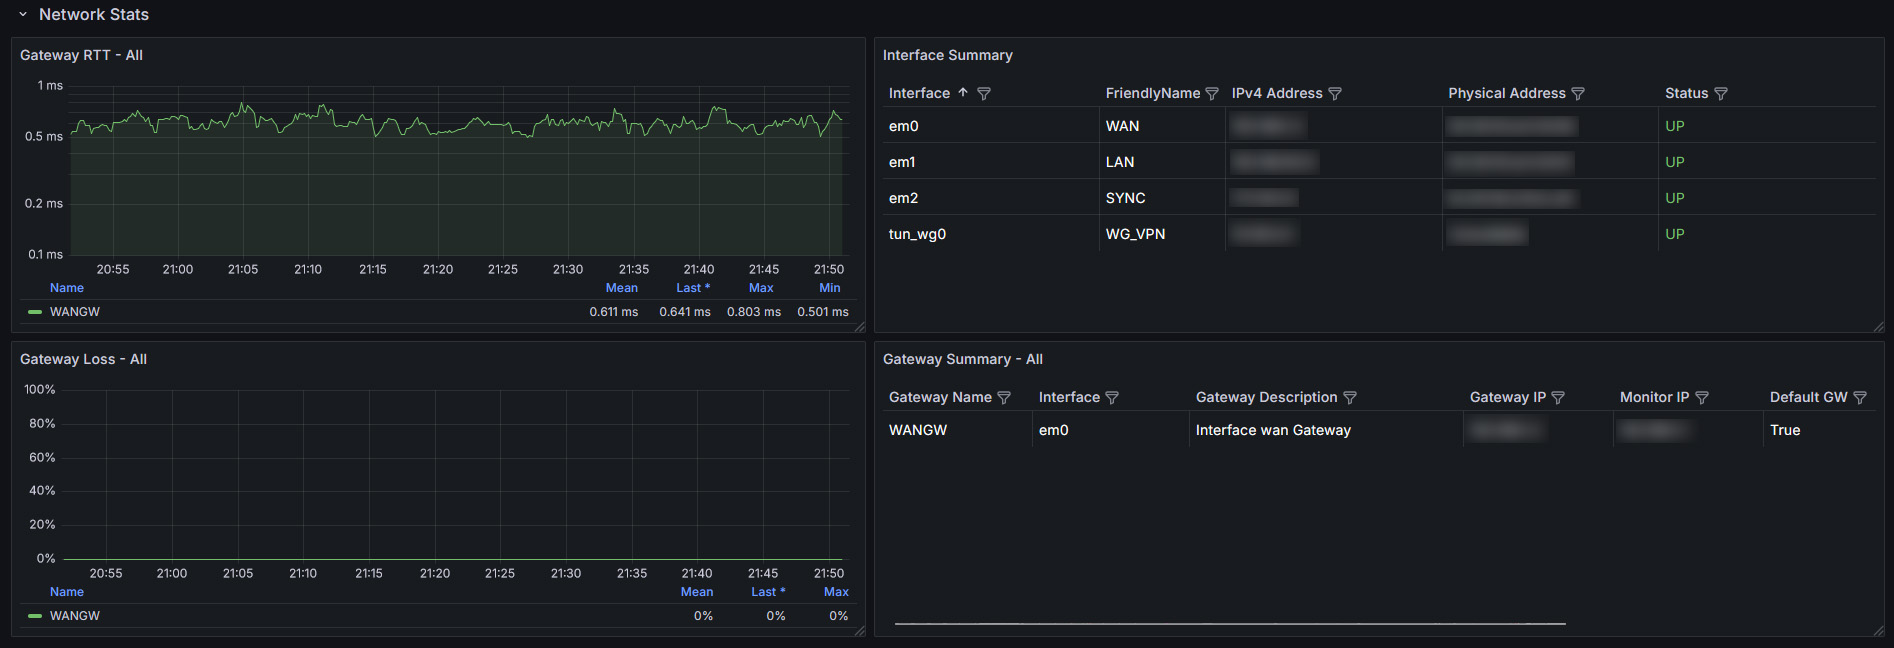

Thanks to that, I basically know everything about my pfsense server.
Proxmox has a built-in metrics sender. It doesn't use Telegraf and send its data via UDP. Considering my Linux servers send their data with HTTP, I made a dedicated database for Proxmox as it doesn't work the same way as the others.
I have a dashboard dedicated to Proxmox. Just like pfSense, I have graphs that give me system information, like CPU usage, load average, disk usage and capacity. It also monitors these metrics for each virtual machine running on the node.


I also monitor network information, which give me the network usage of the node and virtual machines. I also have a more detailed network graph.


Metrics on my Synology NAS are fetched by the Grafana server via SNMP. I have all the required MIBs downloaded so Telegraf can send requests and retrieve the relevant information.
On my NAS, I monitor basic system information just like my other servers. I also monitor the RAID status, disk status and errors, global status, power and fan status.


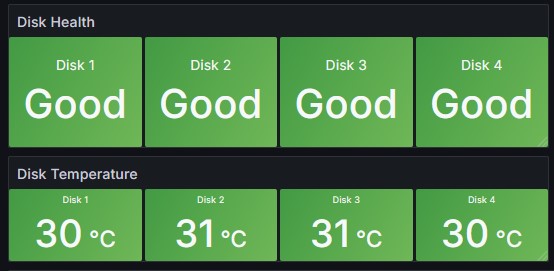


I'm still working on these graphs, as I think I can gather more information from my NAS. But the most important metrics, especially regarding disks health, are there.
On all my Linux servers and firewalls, telegraf is installed and send metrics to the Influxdb database using HTTP. Thanks to that, I don't have to make specific dashboards for each server, as Telegraf sends the same type of information for each server.
I only use one dashboard where I can select a server to view it's info. This dashboard shows the usual system, network, kernel and disk info. At the top of the dashboard, I can select which server I want to check the metrics on.


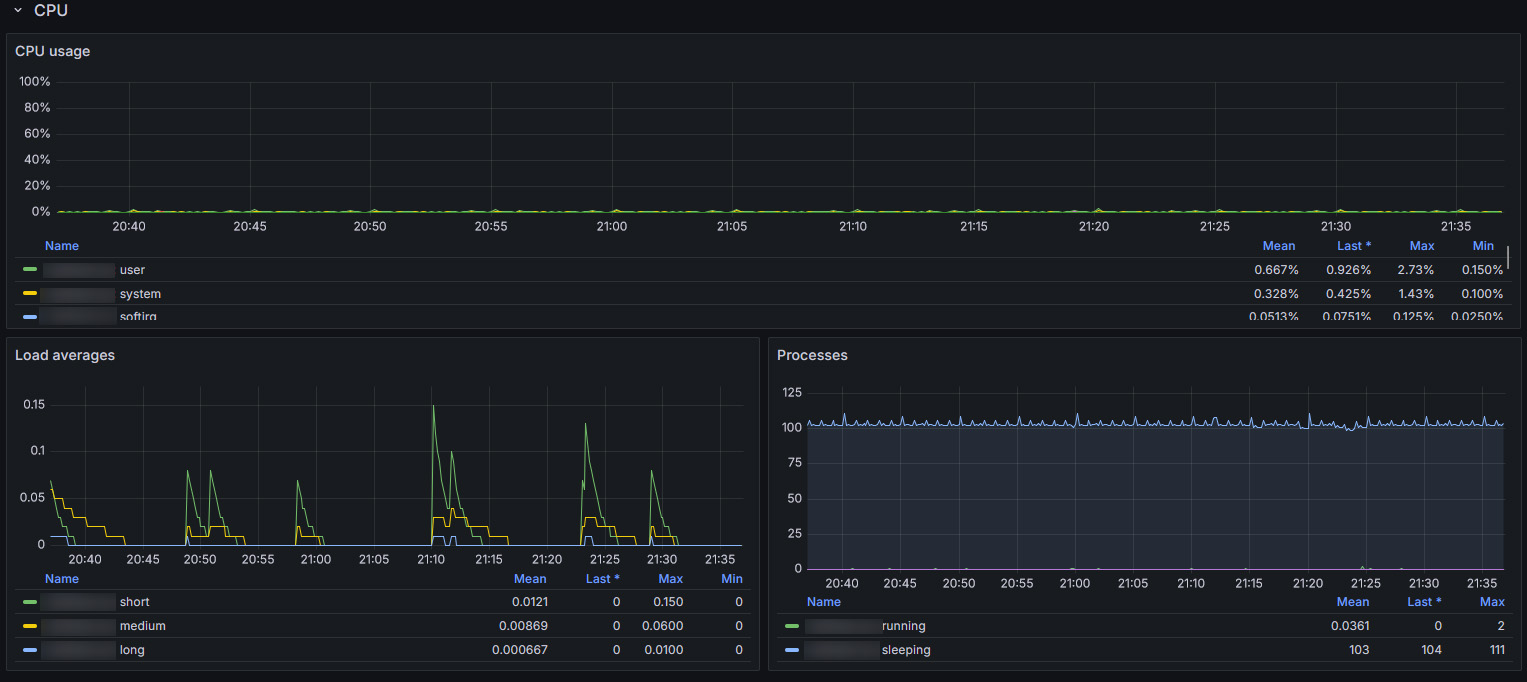


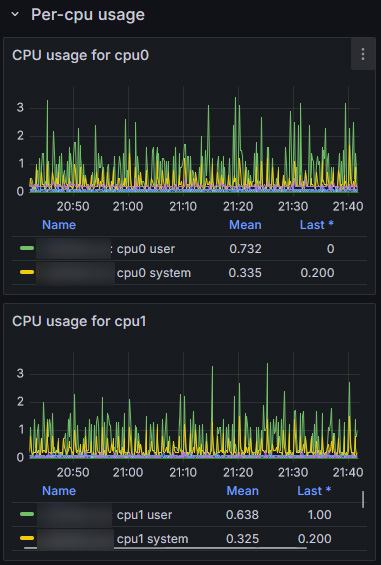


Some graphs, like network graphs, are not working properly yet. I need to work on it so it displays the information I want.
Making this server helped me a lot in learning the TIG stack, which is also used a lot in in professional environments. It's also a nice way of having insights regarding what's happening on my home infrastructure in real time.